Diagnostics
The diagnostics dashboard is an opt-in feature, currently in beta, that allows you to plot various metrics about your printer in a customizable dashboard.
Getting started
To enable the diagnostics dashboard:
- Go to Settings and open the General section.
- Toggle the Diagnostics option on.
- A new Diagnostics page will appear in the navigation menu.
Dashboard
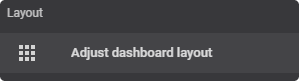
The dashboard is separated into 4 columns and allows you to customize the position of each chart. To edit the dashboard layout, simply open Fluidd's layout editor via the side menu:
Configuration
The dashboard comes preloaded with a chart to plot speeds and flow rates. This should give a general overview on how to configure individual charts. By clicking "Add Chart" or "Edit Chart" in the dashboard, a configuration dialog will open guiding you through the setup process:
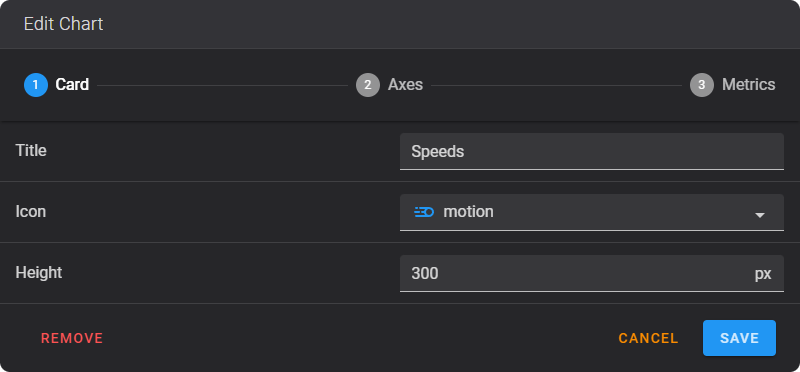
Chart settings
Each chart can be configured with:
- Title — a descriptive name shown in the chart header.
- Axis range — set fixed min/max values or leave them on auto-scale.
- Colors — assign a distinct color to each plotted metric.
- Legend — toggle legend visibility.
Metrics Collector
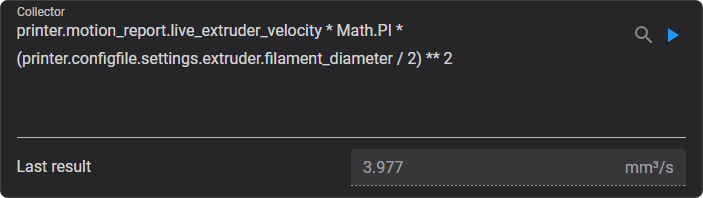
Each plotted metric runs a collector, based on user-defined JavaScript code executed in a sandboxed worker for safety. Metrics are collected once a second or every 250ms when a stepper motor is active.
The default configuration acts as a starting point for scripting your own collectors. You can test your script by clicking the play icon in the collector config.
The example below calculates the current flow rate based on the printers
live_extruder_velocity and the filament_diameter set in the config file.
Collector examples
Here are a few more examples to get you started:
Temperature delta — track how far the bed temperature is from its target:
Fan speed — plot the part cooling fan speed as a percentage:
Extruder power — monitor how hard the extruder heater is working:
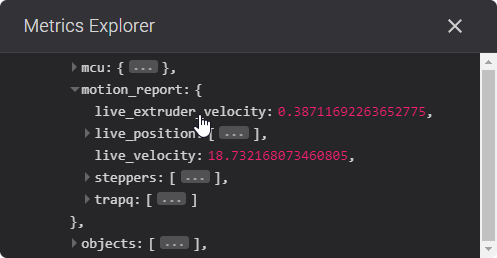
Metrics Explorer
A metrics explorer is available to check the available data points as well as aid in the creation of scripts. Data points can be inserted into the collector script by clicking their key (name) in the metrics explorer.
The data structure mirrors Klipper's printer object model, so any status value Klipper exposes can be accessed in your collector scripts.